Monitor Disk Activity in Mac OS X

You can monitor disk activity in Mac OS X by using the Activity Monitor app or several command line tools. Activity Monitor is the easiest and most user friendly, but the Terminal options allow further information to be retrieved.
Watching Disk Activity on Mac with Activity Monitor
For most mac users who want to quickly get an idea of disk activity, they can check the Activity Monitor application.
- Launch Activity Monitor, located in /Applications/Utilities/, or you can hit Command+Space Bar to bring up Spotlight search and find it that way
- Click on the Disk Activity tab within the Activity Monitor app
- The graph on the right plots Disk Activity
- Pay special attention to “Data read/sec” and “Data written/sec”
What’s causing the disk usage? Sometimes it correlates with CPU usage, and some apps and processes are heavy on both, like when converting video, audio, or Spotlights mds and mdworker. To know for sure, launch the Terminal from /Applications/Utilities/ and read on.
Monitoring Disk Activity from the Command Line
What is shown in Activity Monitor can be somewhat limited, and if you want information specific to what application or process is causing disk input and output, you can launch the Terminal and use the following commands to get more information.
iotop
First up is iotop, which, unsurprisingly given the name, is like top for I/O
sudo iotop -C 5 10
iotop will report back something like this, showing the overall disk read/write, as well as processes, command (or app) and the byte size being written actively by each process:

To easier compare apps and processes that are using the disk, pass the -P flag along with the iotop command, then pay attention to the % I/O column:
sudo iotop -P -C 5 10
iotop can also be narrowed down by disk drive by pointing at the path and using the -m flag. In the example below, the root filesystem only will be watched for activity:
sudo iotop -Pm /
iotop isn’t the only option though…
fs_usage
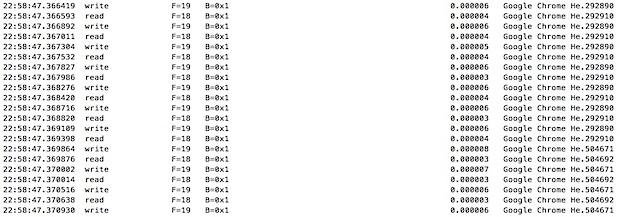
The fs_usage app is another choice to see what’s going on with disk activity and the file system. By default, fs_usage can be bit of a firehose, displaying a ton of data that may be overboard for some basic needs:
sudo fs_usage -f filesys

fs_usage also shows disk reads and writes and the application or process causing them.


csrutil disable.
Read up on it and how to do it (in recovery mode)
I get the dtrace error on all of my macs with LaCie thunderbolt drives.
Thanks for the very useful tips. On 10.7.4 I get the error “dtrace: error on enabled probe ID 5 ” which I had work around by using “2> /dev/null”. Any idea what the issue is?