Enable the Safari Debug Console on iPhone & iPad
![]()
Safari for iOS includes an optional debug console to help web developers track down and resolve issues with webpages on iPhone and iPad.
Even better, with the latest versions of iOS it actually uses the same Web Inspector that Safari on desktop does too, meaning if you connect the iPhone or iPad to the computer you can use the Safari debugging tools directly with your iOS or iPadOS device
Older versions of iOS have this capability too, and while not as in inclusive as the desktop Safari debug and developer tools, it’s still useful and is easy to enable or disable on the iPhone and iPad.
Let’s learn how to enable this feature on both new and old versions of iOS, and learn what’s different between the versions as well.
How to Enable & Use Web Inspector in Safari for iPhone & iPad
On modern iOS and iPadOS versions, here’s how Safari web inspector works:
- Open Settings > Safari > Advanced then tap to enable “Web Inspector”
- Connect the iPhone or iPad to a Mac, then go to Safari and enable the developer menu if you haven’t done so by going to Safari > Preferences > Advanced > Show Develop menu bar
- Pull down the “Develop” menu bar and find the iPhone or iPad, and then open the web page you wish to debug
- Safari Web Inspector will open where you can debug and inspect web elements from the iOS or IPadOS device directly in Safari on the Mac
Now as you navigate on the iPhone or iPad you will find the Web Inspector in Safari on the Mac will update.
You can access the debug Console through the Console tab in the web inspector, and you can access the debugger through the Debugger tab. And of course the usual web inspector tools for elements, resources, network, etc, are available to use as well.

You can also use a View Source trick for iOS and iPadOS while you’re on the go, if needed too.
How to Enable Debug Console on Older iOS Versions
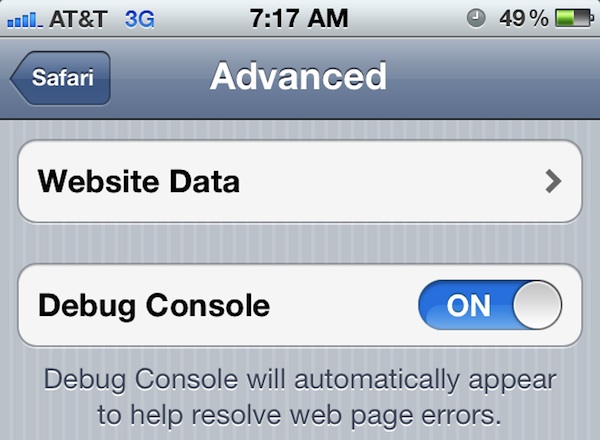
If you have an older version of iOS on an older iPhone or iPad, the whole debug experience is on the device and you don’t have the ability to connect it to Safari on a Mac. Nonetheless it’s still quite useful, here’s how it works:
- Launch “Settings” and tap on “Safari”
- Tap on “Advanced”
- Slide “Debug Console” to ON

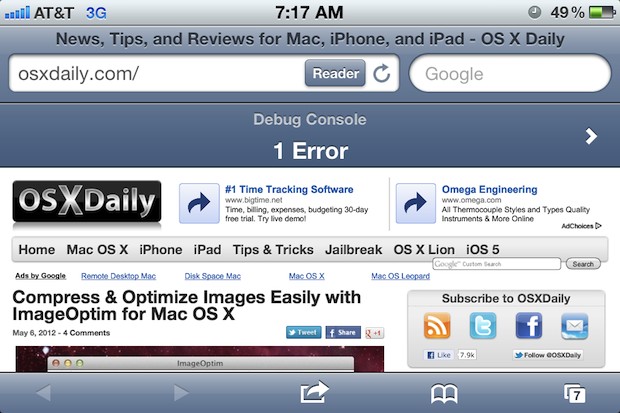
Once enabled, tap on the Debug Console at the top of any Safari screen to see web page errors.

The default list shows all errors, but you can drill down to more specific HTML, JavaScript, and CSS errors by tapping them individually.
Another useful tool for mobile web developers is Firebug Lite for iOS, which utilizes a javascript bookmarklet to load a simpler version of the popular Firebug development tool. That functionality is probably most useful for the older iOS versions as well, since newer releases have new capabilities.
Do you use any web developer tools for iPhone or iPad? Share with us any tips, tricks, apps, or techniques in the comments below.


out dated — no longer accurate
The topmost section is accurate for new iOS versions using Web Inspector, the lower portion is for older versions with Debug Console. Hope that helps!