Watch Network Traffic in Mac OS X via Command Line with nettop
 Mac OS X includes an excellent command line network utility called “nettop” that allows users to monitor all network activity, traffic, and routes from a Mac to the outside world, both through local (LAN) and wide area (WAN) connections. If you’re unfamiliar with networking tools like this, you can think of nettop as a network centric task manager, displaying active networking connections, sockets and routes, their respective names and process id, the state of the connection and whether the connection is established, waiting, or listening, and information about individual process data transfer. It’s a bit like the standard ‘top’ and ‘htop’ commands which show process and resource information, but rather than showing CPU and RAM usage, it will show live network transfer information like packets sent and received, packet size, and total data transferred.
nettop has a wide variety of uses, but it can be particularly helpful when trying to determine what is using the Macs internet connection and networking interfaces, what is communicating with what and how much data is being transferred, and it’s also just a great utility for network troubleshooting. Command line tools aren’t for everyone though, and for users who would like to view similar network information in a more traditional OS X app format, the free Mac app Private Eye is an excellent GUI tool that provides similar information.
Using nettop to Monitor Network Traffic & Connections
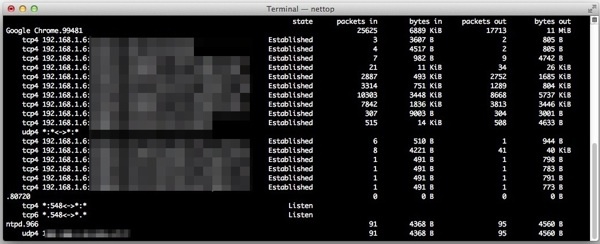
Getting started with nettop is easy enough. Open Terminal from /Applications/Utilities, and at the command prompt, type “nettop” to immediately see active network connections and traffic:
nettop
Use the down arrow key to scroll down and you’ll soon start to identify processes that you’ll recognize by name, coinciding with apps or processes that are currently in use.

For example, you may see an active SSH connection along with the IP you are connected to, and things are particularly busy when you come across web browsers like Safari or Chrome, especially if you’re on a webpage with AJAX, ads, or cookies, because nettop will show you all communication going on between the browser and the remote servers.
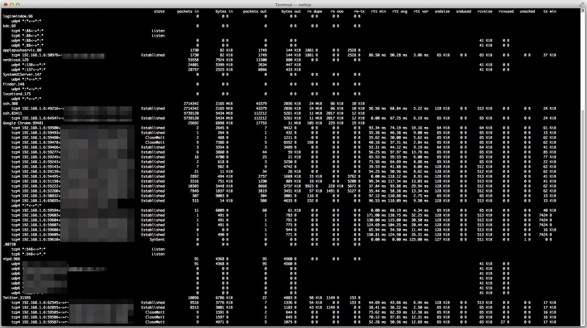
To see the most amount of information, you’ll want to increase the size of the window as large as possible, hit the green maximize button and consider decreasing the font size of the terminal window if you can’t see all that you want to. Hitting the “p” button to put the output displayed by nettop into human readable format is also very helpful for most of us.

Once in nettop you can adjust the output a bit to see more or less information for specific processes and their network communications. Basic nettop commands are:
- p – changes to and from human readable format (i.e.: kilobytes and megabytes rather than pure byte count)
- d – show delta count (i.e.: active change in packet count rather than total packets
- Up & Down arrow keys – navigate up and down in the list
- Right & Left arrow keys – expand or collapse specific process or routing groups
- q – quit out of nettop
Formatting is easy to follow, despite what the pasted sample block looks like below:
                                state      packets in        bytes in     packets out

ssh.83411                                                                            5742633        5438 MiB          112280

    tcp4 192.168.1.6:64547<->sample.ip.com:30      Established         5742633        5438 MiB          112280

Google Chrome.99481                                                                    26448        6934 KiB           18187

    tcp4 192.168.1.6:60829<->181.82-static.reverse.ip      Established               7         523 B                 1

    tcp4 192.168.1.6:54495<->ec2-24-41.compute-1.am      Established            3253         555 KiB            3099

    tcp4 192.168.1.6:51198<->ec2-44-11.compute-1.am      Established            3512         796 KiB            1366

    tcp4 192.168.1.6:55222<->n415s2-in-f1.jj.net:443        Established           10819        3677 KiB            8917

    tcp4 192.168.1.6:52260<->n02-in-f82.55n0.net:443       Established            7981        1866 KiB            3870

    tcp4 192.168.1.6:50832<->webaddress-sample.com:80                Established             313        9177 B               310

    tcp4 192.168.1.6:65035<->dfdssdfsd.com:80                Established             521          14 KiB             514

    udp4 *:*<->*:*
You can also use nettop to just view routing table information if you don’t want to see specific sockets and processes
nettop -m route
The routing information will show the connections from hardware to destination IP, for example, you may see en0 (wi-fi) to the local network IP to a remote server, and you will also see loopback information.
Using the -m flag you can also limit nettop to only show TCP or UDP sockets, with nettop -m tcp and nettop -m udp
There are other ways to see similar information from the command line, including lsof, open_ports, and then, branching away from the command line a bit you can use GeekTool with lsof to have a list of live network connections printed directly over the OS X desktop wallpaper.
For the mobile world with iOS, you can find some similar information with the free networking scanning Fing app, it’s quite a bit more limited but still useful enough to have around on the iPhone and iPad.


Although the command is still there (macOS 10.14.x Mojave) the command keys have obviously changed somewhere down the road of time …
Here’s current help text (Press h to hide/see in nettop)
Available commands:
q – Quit
Up Arrow | w – Scroll Up
Down Arrow | s – Scroll Down
Right Arrow – Scroll Right
Left Arrow – Scroll Left
e – Expand All
c – Collapse All
d – Toggle Delta Output
r – Redraw
l – Redraw in log mode and quit
x – Toggle Readable / Extended Num
j – Bring up the column selection
p – Bring up the process selection
h – Bring up this help menu
love it thanks!
What does “hitting the P button” mean? I’m not seeing any button, and if I did, I couldn’t hit it, since this is a text interface. I tried pressing the P key, but that does nothing.
I hit the P key on the keyboard to change bytes to KB and back: it’s a toggle. However, I only saw the change if I maximized the window.
Try making the terminal window wider an you will see the numbers i.e. in the column “bytes in” changing from 10000 to 10 KiB. Cheers, Matthias
I have Yosemite (10.10.5)
and it exists for me
This command does not exist in Snow Leopard.
That should be specified in your post.
You can install nettop through homebrew if you want to use it on an older unsupported release of Mac OS X.