Monitoring CPU Usage on Mac from Terminal with a better top command
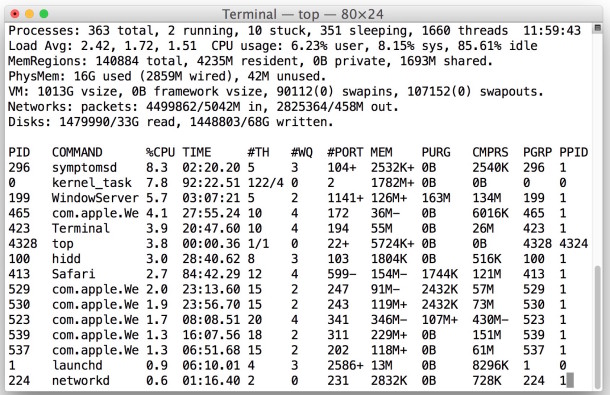
Following the CPU usage on my Mac is a mild obsession, and I usually use the Mac terminal command ‘top’ to do this but I noticed that top itself takes up a fair amount of CPU usage (5% or more). I made this complaint to a friend of mine and they told me to try this variation of the top command instead, which actually causes the top command to use less CPU, making it a bit more helpful and less of an impact on the overall system. This is great if you run top all the time like me.
Here’s the command syntax to use with top, it runs more efficient, and offers more accurate results for some users. This works in Mac OS X and linux too if you happen to be a crossplatformer.
top -F -R -o cpu
Type that in the Terminal and you’ll get a more efficient usage of top that uses less CPU itself, thanks to the flags.
Since it’s helpful to know what you’re entering and it’s impact on the command syntax, here’s an explanation of the flags in use with this variation of top:
-F Do not calculate statistics on shared libraries, also known as frameworks.
-R Do not traverse and report the memory object map for each process.
-o cpu Order by CPU usage
By using top with those flags I have reduced top CPU usage to 1% and it’s also more appropriate for my needs. Try it out!
You can also just simplify things with sorting by cpu alone, but without the -F and -R flags it will continue to calculate frameworks and memory objects, which is not necessarily helpful or actionable.

How can I see the percentage only on the top toolbar on my Mac?
Sorry it’s not called a ‘toolbar’ but the top bar with the Date and username.
Thanks! rick @ dolish.com
[…] on it’s own and it’ll spit out a one-off look at the system stats, or you can just use the top command for similar […]
I wish the OS X (BSD) version of top was more like the one that comes with ubuntu. With that I can press the number “1” and it will display the CPU usage for each CPU/core. You can also press the letter “i” and it will hide all idle processes to clean up the display a bit.
iostat -n0 -w1
This should be significantly less CPU intensive and provide precisely what you’re looking for.
Sampling every second is not useful for me. Therefore I use
top -s 5 -u
which cuts the overall CPU usage of top by 80% too.
The segmentation fault seems to occur with the -F, not the -R.
Save a few keystrokes and use “-u” which is “an alias equivalent to: -o cpu -O time”. Close enough.
top -R -u
works OK and cuts the CPU usage of top by about 80%.
A friend tested the command for me on his machine (also snow leopard) … ‘top -F’ works for him without segfault.
s/-R/-F/
sigh.
Segfault here as well, isolated to the use of the -R switch. Snow Leopard thing?
~$ top -F
Segmentation fault
wtf??
What I don’t like about Top is that is that you can never see every item on the list. It only displays as many processes as will fit in the shell window. Is there a way to make it scrollable?