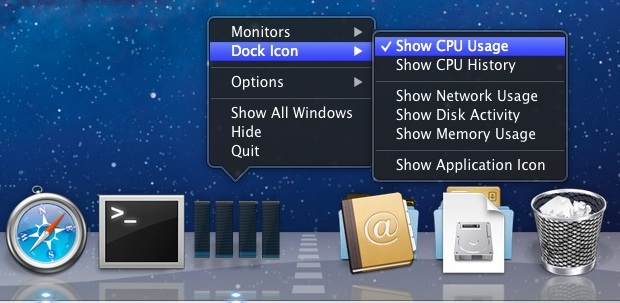
Watch System Activity and CPU Usage from the Mac OS X Dock
Activity Monitor can be used for more than just managing tasks and killing processes, it can also turn the Mac OS X Dock into a live system monitor where you can keep an eye on processor usage, CPU history, network activity, disk activity, or RAM use.

This is really handy if you like to keep an eye on a system resource, as many Mac users do, and since Activity Monitor is bundled with the Mac there are no third party apps to rely on, it’s all built into MacOS X.
How to Monitor System Activity from the Dock in Mac OS X
Transforming the Activity Monitor Dock icon into a live system resource monitor is simple, and makes for an extraordinarily useful tool to keep an eye on various aspects of system behavior:
- Launch Activity Monitor, found in /Applications/Utilities/
- Right-click on the Dock icon and scroll up to the “Dock Icon” submenu and select one of five available options:
- Show CPU Usage – this is a live gauge of processor activity on the Mac, each CPU core is shown as a separate bar, this is probably the most useful of the five choices (shown up top)
- Show CPU History – this shows processor load and use graphed over time, each CPU core is shown separately
- Show Network Usage – displays a graph of incoming (green) and outgoing (red) network traffic, this can be helpful if you’re on a sketchy internet connection or are carefully conserving bandwidth
- Show Disk Activity – shows a live graph of disk reads (green) and writes (red) in the same format as Network Usage
- Show Memory Usage – displays a pie chart of current RAM usage and allocation on the Mac, green is free memory, red is wired, yellow is active, and blue is inactive memory

You can close out of the primary Activity Monitor window but keep the Dock icon active, to do that just click the Red close button, which will ditch the window but leave the app itself running, thus maintaining the live activity icon in the Dock. You can also choose to minimize the primary window to get the same effect, though the minimized window will maintain itself in the Dock as well.
If you find yourself using this often, you may want to pin Activity Monitor to the Dock by right-clicking and choosing “Keep in Dock” from the Options submenu. I keep this active in my Dock at all times, but I’m a bit of a geek and a bit obsessive about monitoring CPU activity and performance, making sure things are running at optimal conditions at all times.
Here is what the CPU usage looks like on a Mac with quad core CPU (the number of bars represents the number of cores or processors):
![]()
Here is what the memory usage pie chart looks like:

And here is what Disk Activity and Network Activity look like:

If the Dock isn’t your thing, the iStat Menu bar item offers similar features in the menu bar.
Personally, I rely on the Activity Monitor Dock icon all the time for CPU monitoring, it helps to identify when a process has gone errant or haywire, but everyone has different requirements and needs. Try it out and see if it works for you.
Thanks to Roman for the tip idea


[…] time, minimize Activity Monitor, then right-click on it’s Dock icon to enable various system activity monitors right in the Dock which will show live graphs instead of the standard icon. You can set them to be specific to CPU […]
[…] than watching system activity in Activity Monitor, have you ever wished you had physical analog meters on your desk that showed you what was going on […]
[…] Via | OSXDaily […]
I use MenuMeters by Raging Menace. Very customisable. Displays in the menu bar rather than the dock, but provides details on pretty much anything you’d want to know.
THX!!!!
Strange, I have a quad core i7 Macbook Pro and I can only see 1 core displayed and not 4 cores as in your article.
On top of that there is no activity whatsoever in the graphical representation in the dock.
Are there any other parameters to look for?
Mac OS X 10.7.3 Lion
Macbook Pro 15″ 2.3 GHz Intel Core i7
It shows up on my Core i5 MacBook Air as 4 cores despite being a dual core machine, I think in your case it might be interpreting your quad core as 8 cores due to hyperthreading (4 core + 2x hyperthreading) and there’s not enough room in the Dock icon to display 8 bars so it only displays 1. Activity is visible if you pegged the CPU hard enough, but consider that it’s reading 8 as 1 the overall load is dispersed widely across the 8 threads and therefore shows virtually no activity. Do something CPU intensive to verify this of course, but you can also select the Monitors > CPU Usage to display a floating window which will display each CPU core use.
If you have Lion, then that is normal. Using the kernel’s multithreading technology it displays all cores as one (windows 8 does this as well).
One way to prove it is download something like handbrake and have it encode a movie, and you will notice it will surpass over 100 percent on the CPU cycles (for my 2011 macbook pro it went over 600, meaning it have approx 6-7 cores in use)
Hi
Neat tip and it suits the blog.
However I find using Geektool (free) and a few scripts (found online) better – I currently have CPU usage monitored, memory usage (& found through this that something I use or OSX itself has a memory leak, and hard disk usage