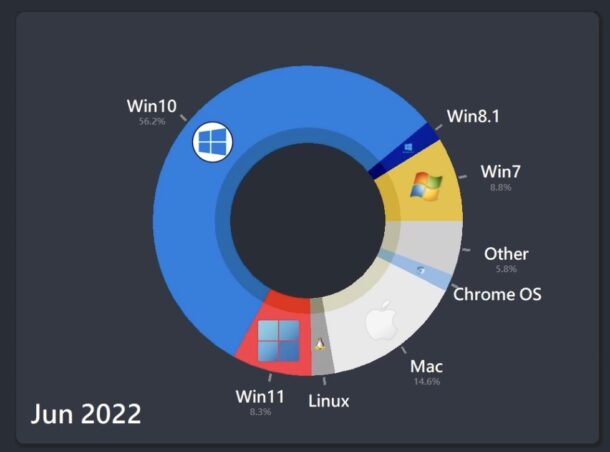
Watch a Visualization of the Most Popular Desktop Operating Systems Over 20 Years

Everyone knows that Windows has been the most popular desktop operating system by market share for a long time, and if you roll back the clock 20 years you will find that MacOS had a itty bitty slice of the desktop operating system market of around 4%.
But fast forward 20 years, and things have changed quite a bit. Not only has the versions of Windows changed, but so has the Windows market share. In those two decades, the Mac desktop market share has quintupled, while the share of Windows has reduced dramatically as it loses marketshare to Mac, Linux, Chrome OS, and others.
Watch the video below to see this as an animated visualization, as you see Windows XP, Windows 98, and Windows NT slowly melt away to give rise to Windows Vista, Windows 7, Windows 8, Windows 10, Windows 11, and of course MacOS, Linux, Chrome OS, and “others”.
Since this is focusing on the desktop operating system market share, you won’t find iOS or iPadOS included in this list, which has a huge dominance in the mobile operating system race. Mobile operating system are an arena that Microsoft completely gave up competing in as they long ago threw in the towel on Windows Mobile, leaving consumers the duopoly choice of iOS or Android.
Does anyone else kind of wish Microsoft had kept up with Windows Mobile, so there would be more alternative mobile operating systems out there, or is it just me? I personally would still use an iPhone, but more competition is a good thing for consumers.
This visualization is provided by VisualCapitalist. Where will things be in another 20 years? Will we all be wearing Apple Vision headsets with virtualized macOS desktop environments floating in digital space? One can only ponder, but the future is coming one way or another.

