How to See Long Term Stock Performance Charts in iPhone Stocks App (5 Year & 10 Year)
The Stocks app on iPhone makes it easy to keep an eye on the markets and portfolio holdings, and you can quickly see what performance is on a given day with just a quick glance. Once you select an individual ticker symbol or market index, you’re able to drill down further, with Stocks app offering chart views of activity over ranges of 1 day, 1 week, 1 month, 3 months, 6 months, 1 year, and 2 years. Those are undoubtedly helpful views of stocks and holdings, but for longterm investors, those are pretty short periods of time, and many like to see charted longer term performance of returns (or lack thereof) over a 5 year and 10 year period. Thanks to a little known trick on the iPhone, you can quickly see the long term 5 year and 10 year performance charts of any ticker in Stocks app.
This is a super simple tip for the iPhone Stocks app, but it’s largely unknown and fairly well hidden,
here’s what to do to check long-term charts. Be sure you have added a few stocks or ticker symbols to the Stocks app on iPhone to get use of this trick.
1: Select the Stock Ticker or Market Index in Stocks App
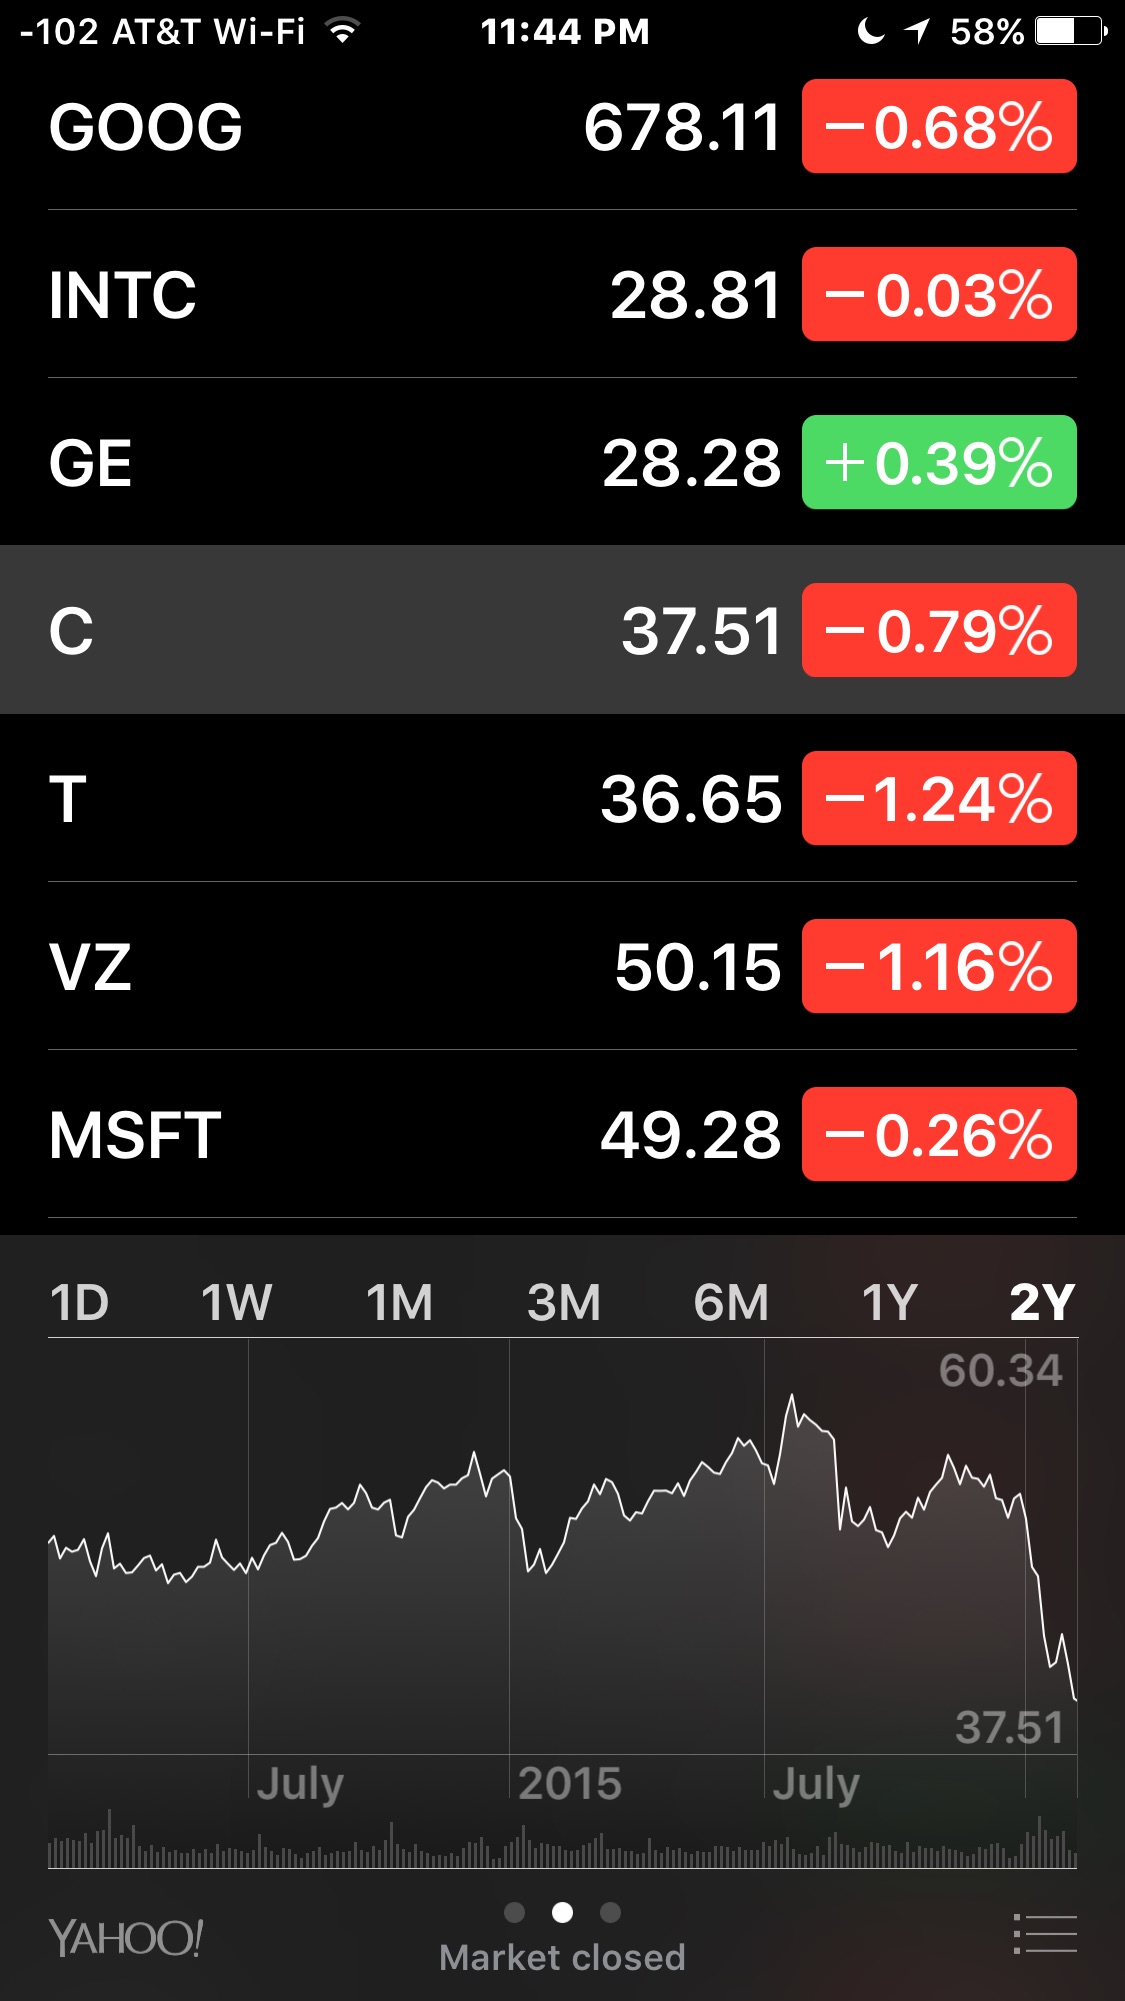
First, open the Stocks app as usual. Then navigate to and tap on the ticker symbol or market index that you’d like to see the longer term 5 year or 10 year performance view for. In the example below, we choose “C” for Citibank:
2: Rotate the iPhone Screen to See 5 Year & 10 Year Chart Range Options
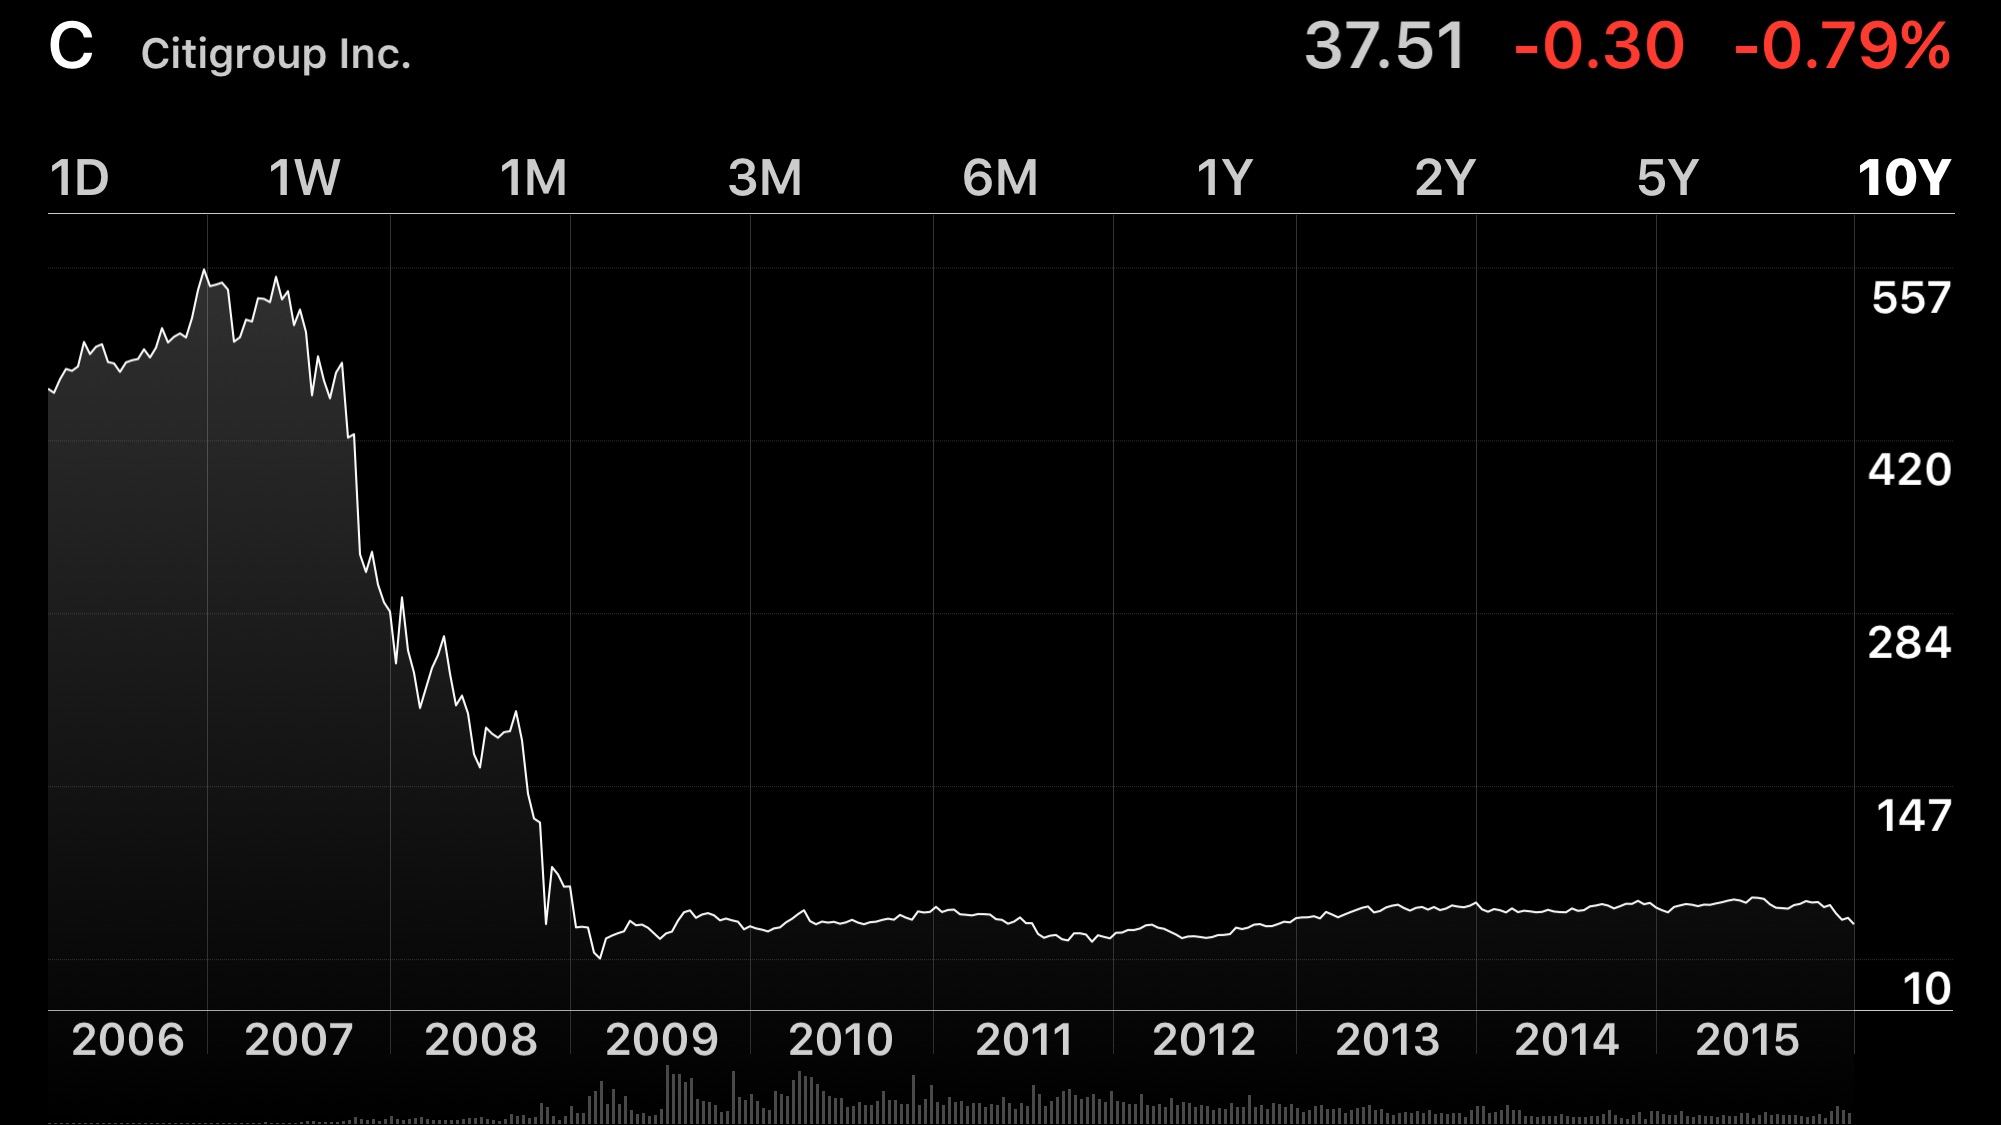
Once the selected stock ticker or market index is selected in Stocks app, simply rotate the iPhone screen to be horizontal. You’ll now enter into a larger performance chart view which reveals two additional range options: 5 year and 10 year, simply tap on one of those to see the long term performance of the chosen ticker symbol. Here is the same “C” ticker in a 10 year view, impressive:
Once you’re in the horizontal performance view, you can swipe left or right to see other stock symbols and market indexes that have been added to the Stocks app watch list. This is a great feature even if it’s little known, perhaps future versions of Stocks app will add technical indicators on the horizontal view as well.
Remember you can also get quick stock market details from Siri, though Siri has some issues getting long term chart data and thus you’ll still want to use the Stocks app or a separate app like the Bloomberg Business app for better chart data.
This feature of Stocks app is really great, especially since long-term performance is what often matters the most to people building a nest egg or retirement account. It’s useful enough that one could imagine similar longterm graphing and performance specifics available in other iPhone apps too, particularly with apps like Health and Activity, where the ability to view longterm performance or any specifics is severely lacking, hopefully similar features will arrive to other apps in the future.
Of course if you don’t care about the stock market and don’t use Stocks app you likely won’t care about this feature, and in that case you may even prefer to remove the Stocks widget from the Notification center of iOS as well.

I just noticed the same thing. This app, which was one of my top ten favorite apps has dropped the 5 year and 10 year charts. Ben Graham (Warren Buffet’s professor) is rolling over in his grave at this. This is steering the younger generation to ignore long term performance, which could be argued quite easily is steering them in the wrong direction.
Can we request PLEASE that the individual or individuals executive(s) [bonehead(s)?!?] who made this decision to reverse this in the next version
Is this the sign of Apple converting to a complete mass marketing approach (appealing to the lowest common denominator)?
This is not how they began to build great products like the old stock app!
The new stocks app does not show landscape view for long term chart, someone messed up getting rid of this view, even if not use often its most likely cause people did not know about it. iOS 12 stocks app is worst than last build.
It’s too bad that when you view a chart in landscape mode and tap n move, the dot doesn’t match the chart data when you scroll. Whether on 1 week, 1 month, 3 months, etc. the dot doesn’t snap to the data. It’s either shifted vertically or horizontally. This is quick n easy whenever I’m ready to place a limit order – on buy or sell side. Maybe they’ll fix this in iOS 12.
How updated is the stocks app?
Stocks app refreshes data every time you launch it, but for more professional uses Bloomberg Business (free, no restrictions) and Bloomberg Professional (requires a Bloomberg login) are often better.
Lol great return on that example! They had a reverse split too.
I just saw this for the first time and can’t believe that Citibank was at around $560 a share back in 2007 and now is at $37 a share and has been that way since 2008. That is a HUGE drop that makes the stock almost worthless and the fact that it has hardly moved in 8 years is SCARY!