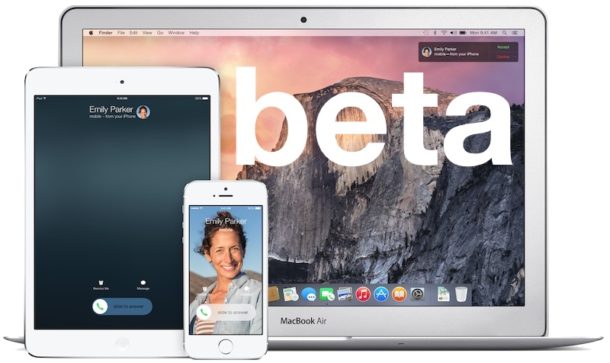
Download & Install MacOS Sierra Public Beta Right Now

MacOS Sierra Public Beta is now available to download and install for any Mac user interested in testing the upcoming operating system. Remember that beta system software is less stable and notoriously buggy, so this experience is recommended for more advanced users or those with a secondary computer they don’t mind running beta system software on.
This guide will walk through how to enroll in the macOS Sierra public beta program, as well as how to download and install macOS Sierra 10.12 public beta onto a Mac.
Read more »


